In this post, I will discuss features of freemium products, which I work with mainly, and introduce the complex parameter F-Growth, which is useful both for internal and external assessments of freemium products, especially from the viewpoint of investing in and marketing them.
The business model based on the freemium principles (this term was coined of the words “free” and “premium”) involves maximum propagation of the product in the related market, and capture and retention of the maximum possible number of users.
As a rule, there two business approaches to creating freemium products are used:
Freemium products are characterized by the following models of interaction with the user base:
The business model based on the freemium principles (this term was coined of the words “free” and “premium”) involves maximum propagation of the product in the related market, and capture and retention of the maximum possible number of users.
As a rule, there two business approaches to creating freemium products are used:
- Purchase and other paid-for attraction of users (traffic). Partial monetization of the traffic by selling additional paid-for functionality. New users are attracted by using the earned profit.
Within this approach, the key factor is cash: it is necessary to have a successful monetization model, involve a significant percentage of users in paid-for mechanisms, and maintain the balance of the incomes from the existing users against the costs of attracting new users. It should be remembered that the costs of attracting new users can be significant, and there is a risk of being unable to meet them using the monetization income.
The advantages of the approach are that first money starts to be earned fast, and the virality K-factor can be less than unity. - Involvements of users in product promotion: Virality. One should ensure that the virality coefficient (K factor) is significant, which is complicated and, for some products, unachievable. In the framework of this approach, the user base grows exponentially up to saturation.
Freemium products are characterized by the following models of interaction with the user base:
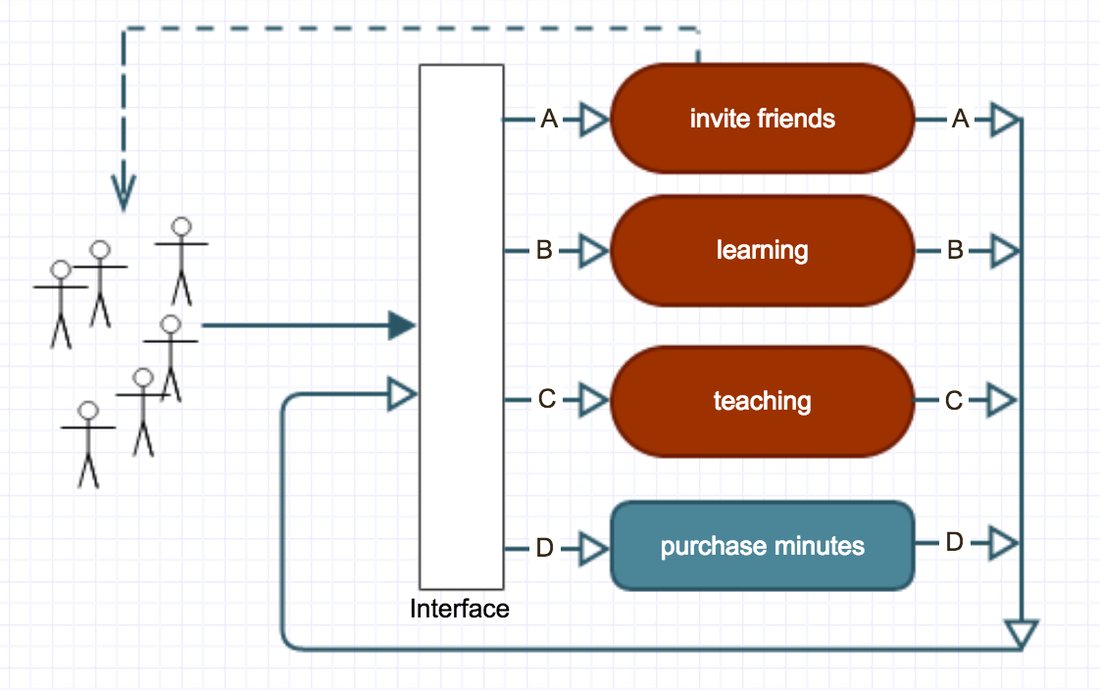
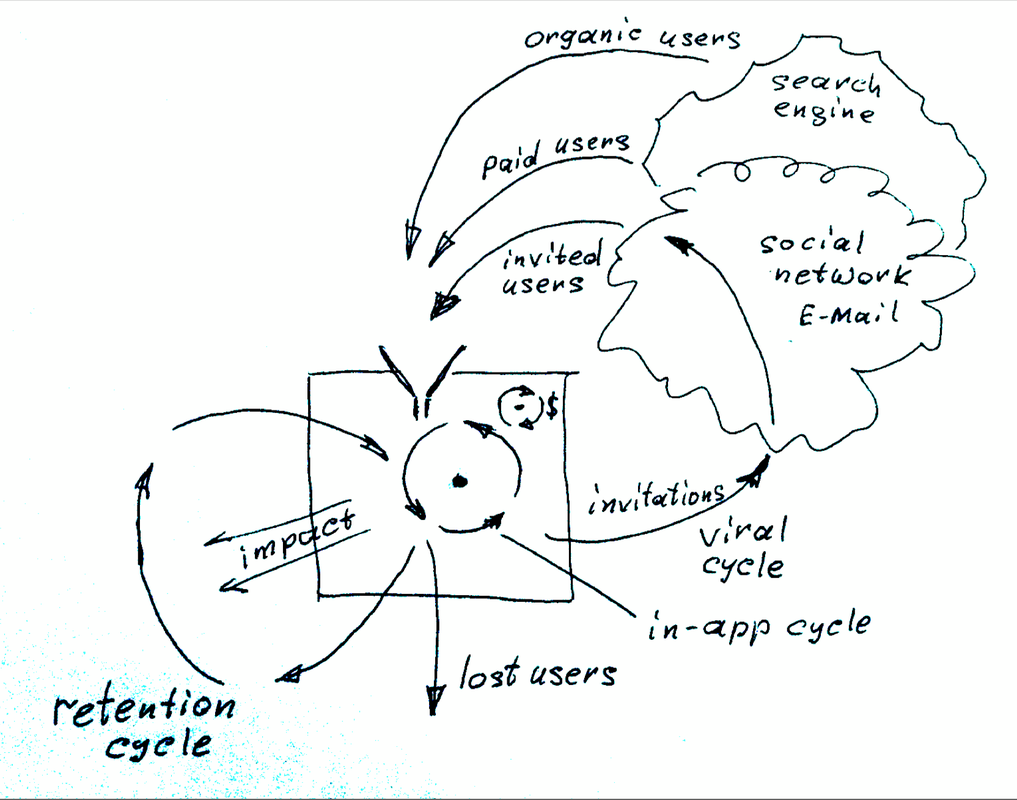
- in-app cycle — the core cycle of the application, the basic function, which corresponds to a user’s choice of the application (in our case, studying a foreign language with a help from a native speaker);
- monetization cycle (the smaller circle labeled “$” in the Figure) — supplementary cycle involving the most venturous and loyal users and providing them with additional functionality. This cycle is smaller, since not all users get involved (this is a feature of the freemium business model);
- Retention cycle — withdrawal of users from the system and their consequent return to the system. Successful return and retention is ensured by a set of actions, starting from e-mailing and sending messages via social networks and other communication channels to remind users about events taking place in their absence, and ending at gamification.
- Viral cycle — existing users invite new users from external environment (e-mail, social networks, blogs, forums, personal sites, applications, and other communication channels), accommodation of new users included.
David Skok, a successful venture capitalist, in his paper The Power of Free, The Entrepreneurs (December 2009) mentions the following important aspects of freemium products aimed at viral growth:
“..in a typical business the single biggest expense is sales and marketing, and recognize that offering a free product/service is an extremely smart way to acquire customers at a low cost that can then be monetized in a different way.” “Another powerful effect of using the free strategy is that it usually results in a far larger customer base using the free products, who become proponents for your company. This expanded footprint or market share can have a huge effect on the price that acquirers or investors are willing to pay for your company, as they recognize that even though these customers have yet to be monetized, they represent a great potential for future monetization. Twitter and Facebook are two perfect examples of this.”
For practical purposes, I calculate the local k-factor as the ratio between the number of users attracted by viral methods within a conventional period and the calculation base, which can be the number of only new users (dNU), all users within the period (dU) or only those users which stayed active within the period:
local K-Factor = dIU / dAU
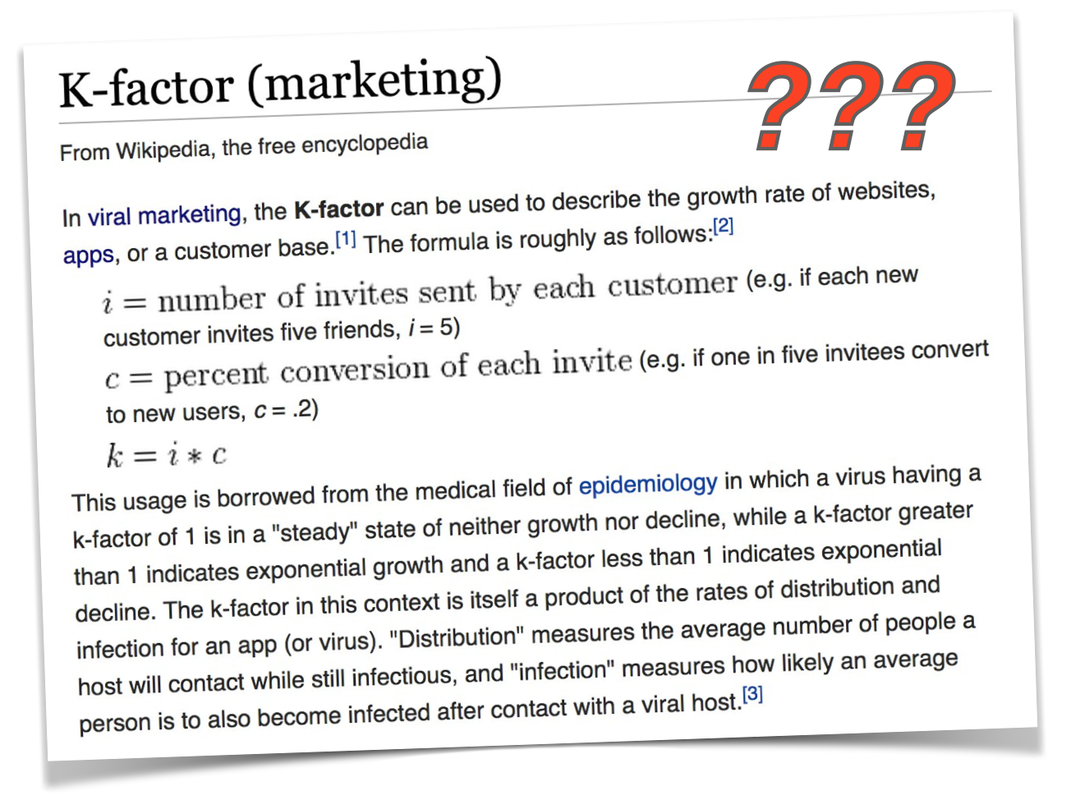
the term “k-factor” is borrowed from epidemiology, where a virus having a k-factor of 1 is in a "steady" state of neither growth nor decline, while a k-factor greater than 1 indicates exponential growth and a k-factor less than 1 indicates exponential decline.
The k-factor, which is commonly called the viral coefficient in literature, can be calculated as the number of invitations sent by each user, which is multiplied by the ratio of conversion of each invitation to a user. For example, if the average number of invitations is equal to 5, and the invitation conversion ratio is 20%, then the k-factor is k × 0.2 = 1 (the k-factor with no allowance for the period is called the “global k-factor”).
IPi = IU / i
(Ratio of invited users and the number of invitations, where IU is the total number of the invited users, and I is the total number of invitations)
AiPU= i / U
(Average number of invitations per user, where I is the total number of invitations,
and U is the total number of users)
K-Factor = AiPU* IPi
(Global k-factor)
The dynamics of the k-factor reflects changes in users’ behavior, the way they react to appearance, activation, or deactivation of various viral mechanisms, which involve them in inviting new users, and how well these mechanisms are apprehended.
Thus, for practical purposes the authors use the local k-factor calculated daily on the basis dAU, i.e., the active user base.
It is important to understand here that if the k-factor is less than 1 (e.g., 30%), then in the absence of retention (i.e., when the loyalty of the existing users is zero), the growth of the system dies out. At best, this viral mechanism counterbalances partially the loss of users which results from the normal loyalty drop in the retention cycle. This k-factor increases the efficiency of paid-for user attraction. For example, 100 paid-for users take part in the operation of the viral mechanism and invite 30 users more. This reduces the averaged involvement cost and cuts budget expenses.
If the k-factor exceeds 1, the user base grows exponentially.
Interconnectedness of Virality, Retention, and Monetization
All three parameters (Virality, Retention, and Monetization) are interconnected. Higher-loyalty users are more likely to participate in the viral mechanisms and get involved in Monetization.
Despite the fact that they compete in attracting user’s attention, these mechanisms can spur each other, and various techniques, such as gamification, can serve both Monetization and Virality.
I wrote about that in the article called “PARADOXICAL MOTIVATION”
For example, if virality is strong, and retention is weak, the growth of the user base due to successful virality will be counterbalanced by the losses in this base to low loyalty of the users. And contrariwise, weak virality and perfect retention will make the product and its user base stagnant and, in the long run, result in a loss in the competition.
The coefficient of inherent growth of the product user base (F-growth) can be expressed as a sum of the viral coefficient (k-factor) and the retention coefficient (k-retention):
F-Growth = K-Factor + K-Retention
In my opinion, this is the main formula for the growth of a virality-based freemium product. One can see that it does not allow for alternative methods of client involvement, such as paid users, organic users, i.e., those who come in via search engines, world-of-mouth, or high brand awareness.
K-retention is always less than unity in long time intervals, since there is no product capable of retaining 100% of its user base at all times.
Local K-retention = (dAU - dNU) / dAU-1
where dU is the user base on a given day, dU-1 is the user base on a previous day, and dNU is the amount of new user in this period. For calculation, it is convenient to allow for the active user base only.
For example, if the viral coefficient is equal to 20%, and the retention coefficient is k-retention = 90%. i.e., 9 of 10 clients use the service on the next day, then F-growth will be equal to 0.2+0.9 = 1.1. Such a system will grow independently, day after day adding 10% of its user base per day (or any other calculation period).
F of inherent growth can be represented as:
F-Growth = (dAU – dNU + dIU) / dAU-1,
i.e., it is the ratio of the user base of the following period with no allowance for new users, but allowing for those invited by using viral methods, and the user base of the previous period.
If dNU and dIU are equal, i.e., all new users are attracted due only to viral methods (there is no paid-for or organic traffic), then F-Growth = dAU / dAU-1 .
Conclusions:
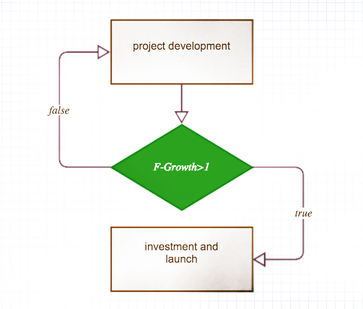
If the growth coefficient (F-Growth) is less than 1, the product cannot grow and loses its user base with all that it implies for the project.
On the other hand, if one achieves the value of the growth coefficient exceeding 1, the product starts growing exponentially. This is the absolute target, when the product team achieves non-paid user base growth. This is necessary for project capitalization which exceeds investments in buying of the user base.
Thus, when creating a freemium product, it is reasonable to market it and check the virality- and retention-related mechanisms using small volumes of the paid-for or attracted in any other way user base, more so since these mechanisms can be assessed statistically and analyzed. Having achieved a positive value of F-Growth, one can mobilize a round of venture investments and advance the product to a major market. In the opposite case, if the project is incapable of increasing its user base, i.e., F-growth < 1, the raised money will be wasted.
“..in a typical business the single biggest expense is sales and marketing, and recognize that offering a free product/service is an extremely smart way to acquire customers at a low cost that can then be monetized in a different way.” “Another powerful effect of using the free strategy is that it usually results in a far larger customer base using the free products, who become proponents for your company. This expanded footprint or market share can have a huge effect on the price that acquirers or investors are willing to pay for your company, as they recognize that even though these customers have yet to be monetized, they represent a great potential for future monetization. Twitter and Facebook are two perfect examples of this.”
For practical purposes, I calculate the local k-factor as the ratio between the number of users attracted by viral methods within a conventional period and the calculation base, which can be the number of only new users (dNU), all users within the period (dU) or only those users which stayed active within the period:
local K-Factor = dIU / dAU
the term “k-factor” is borrowed from epidemiology, where a virus having a k-factor of 1 is in a "steady" state of neither growth nor decline, while a k-factor greater than 1 indicates exponential growth and a k-factor less than 1 indicates exponential decline.
The k-factor, which is commonly called the viral coefficient in literature, can be calculated as the number of invitations sent by each user, which is multiplied by the ratio of conversion of each invitation to a user. For example, if the average number of invitations is equal to 5, and the invitation conversion ratio is 20%, then the k-factor is k × 0.2 = 1 (the k-factor with no allowance for the period is called the “global k-factor”).
IPi = IU / i
(Ratio of invited users and the number of invitations, where IU is the total number of the invited users, and I is the total number of invitations)
AiPU= i / U
(Average number of invitations per user, where I is the total number of invitations,
and U is the total number of users)
K-Factor = AiPU* IPi
(Global k-factor)
The dynamics of the k-factor reflects changes in users’ behavior, the way they react to appearance, activation, or deactivation of various viral mechanisms, which involve them in inviting new users, and how well these mechanisms are apprehended.
Thus, for practical purposes the authors use the local k-factor calculated daily on the basis dAU, i.e., the active user base.
It is important to understand here that if the k-factor is less than 1 (e.g., 30%), then in the absence of retention (i.e., when the loyalty of the existing users is zero), the growth of the system dies out. At best, this viral mechanism counterbalances partially the loss of users which results from the normal loyalty drop in the retention cycle. This k-factor increases the efficiency of paid-for user attraction. For example, 100 paid-for users take part in the operation of the viral mechanism and invite 30 users more. This reduces the averaged involvement cost and cuts budget expenses.
If the k-factor exceeds 1, the user base grows exponentially.
Interconnectedness of Virality, Retention, and Monetization
All three parameters (Virality, Retention, and Monetization) are interconnected. Higher-loyalty users are more likely to participate in the viral mechanisms and get involved in Monetization.
Despite the fact that they compete in attracting user’s attention, these mechanisms can spur each other, and various techniques, such as gamification, can serve both Monetization and Virality.
I wrote about that in the article called “PARADOXICAL MOTIVATION”
For example, if virality is strong, and retention is weak, the growth of the user base due to successful virality will be counterbalanced by the losses in this base to low loyalty of the users. And contrariwise, weak virality and perfect retention will make the product and its user base stagnant and, in the long run, result in a loss in the competition.
The coefficient of inherent growth of the product user base (F-growth) can be expressed as a sum of the viral coefficient (k-factor) and the retention coefficient (k-retention):
F-Growth = K-Factor + K-Retention
In my opinion, this is the main formula for the growth of a virality-based freemium product. One can see that it does not allow for alternative methods of client involvement, such as paid users, organic users, i.e., those who come in via search engines, world-of-mouth, or high brand awareness.
K-retention is always less than unity in long time intervals, since there is no product capable of retaining 100% of its user base at all times.
Local K-retention = (dAU - dNU) / dAU-1
where dU is the user base on a given day, dU-1 is the user base on a previous day, and dNU is the amount of new user in this period. For calculation, it is convenient to allow for the active user base only.
For example, if the viral coefficient is equal to 20%, and the retention coefficient is k-retention = 90%. i.e., 9 of 10 clients use the service on the next day, then F-growth will be equal to 0.2+0.9 = 1.1. Such a system will grow independently, day after day adding 10% of its user base per day (or any other calculation period).
F of inherent growth can be represented as:
F-Growth = (dAU – dNU + dIU) / dAU-1,
i.e., it is the ratio of the user base of the following period with no allowance for new users, but allowing for those invited by using viral methods, and the user base of the previous period.
If dNU and dIU are equal, i.e., all new users are attracted due only to viral methods (there is no paid-for or organic traffic), then F-Growth = dAU / dAU-1 .
Conclusions:
If the growth coefficient (F-Growth) is less than 1, the product cannot grow and loses its user base with all that it implies for the project.
On the other hand, if one achieves the value of the growth coefficient exceeding 1, the product starts growing exponentially. This is the absolute target, when the product team achieves non-paid user base growth. This is necessary for project capitalization which exceeds investments in buying of the user base.
Thus, when creating a freemium product, it is reasonable to market it and check the virality- and retention-related mechanisms using small volumes of the paid-for or attracted in any other way user base, more so since these mechanisms can be assessed statistically and analyzed. Having achieved a positive value of F-Growth, one can mobilize a round of venture investments and advance the product to a major market. In the opposite case, if the project is incapable of increasing its user base, i.e., F-growth < 1, the raised money will be wasted.